Sure, think of Smartsheet as a high-powered tool belt, not just a hammer like Excel. While Excel is great for basic tasks, Smartsheet is like having a whole set of tools that work together. It’s built for teams who need to keep track of projects with lots of moving parts. It automates the repetitive stuff, talks smoothly with other programs like ArcGIS, and keeps everyone on the same page in real-time. It’s more about managing work efficiently than just doing spreadsheets. For folks in construction and engineering, where you’ve got to juggle a lot of details and coordinate with different people, Smartsheet is a game changer.
You’re right to be skeptical. In the utility industry, it feels like every tech company is trying to get a piece of the pie, selling their “miracle” solutions. It’s hard to know what’s real and what’s just hype.
But I’m not here to sell you a miracle. As someone who’s been in the trenches of the utility industry, I know there’s no one-size-fits-all solution to our challenges. We can’t just wait for some tech company to fix our problems. We’ve got to roll up our sleeves and do it ourselves.
That’s where you come in. You know your job inside and out. You’re the one replacing meters, fixing drills, and handling the day-to-day. You’re the expert, not some tech guru.
So here’s the straight talk: Smartsheet isn’t just another spreadsheet. It’s a tool that empowers you, the real expert, to solve problems more efficiently. It’s about making your hard work pay off better, not about complicating things with fancy tech jargon.
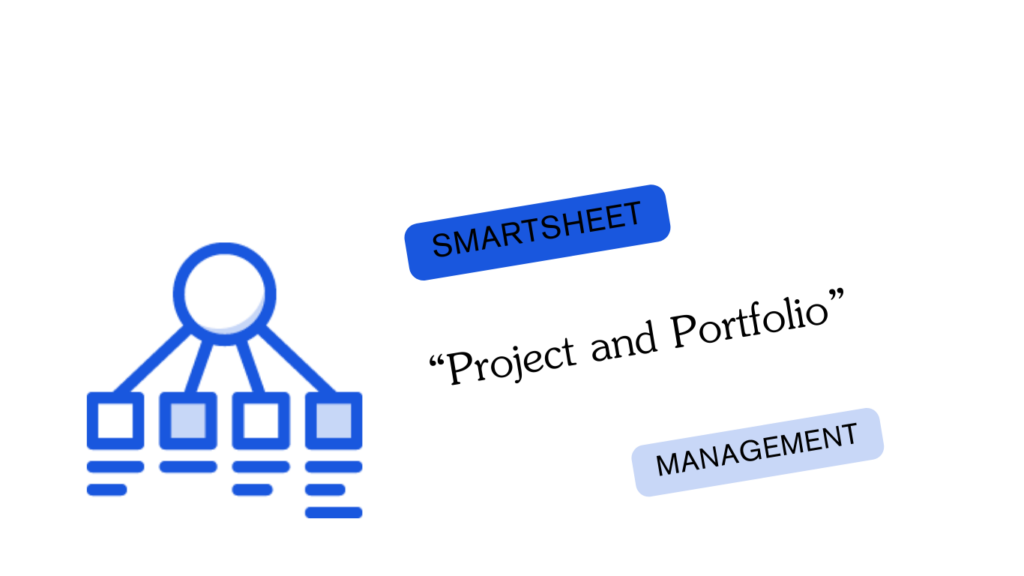
Let’s take a closer look and see how Smartsheet can make a real difference in your work.
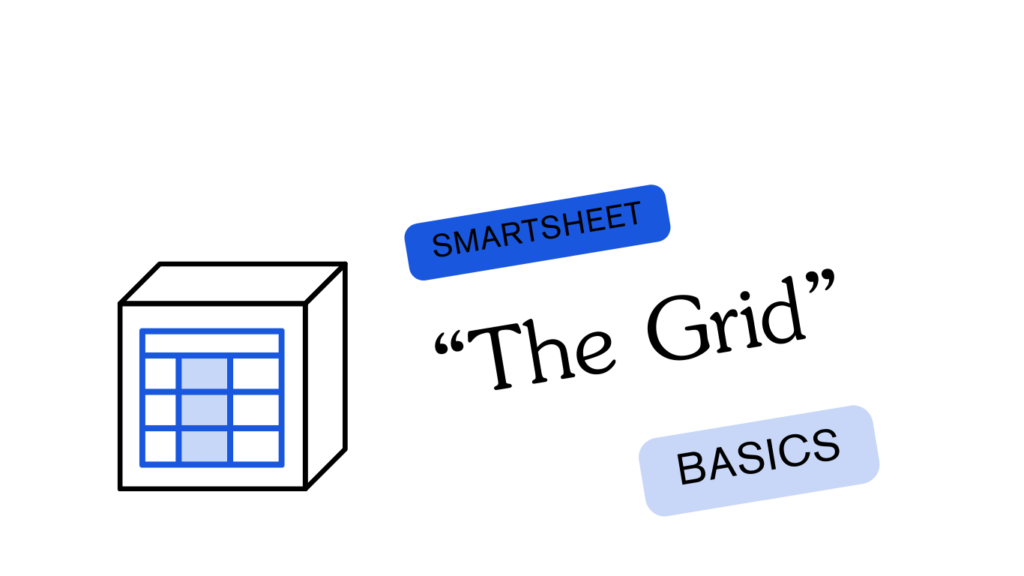
The Smartsheet "Grid"
The Smartsheet "Grid"
Alright, let’s break this down in plain terms. When you think Smartsheet is just like Excel, you’re hitting the nail on the head in one way. It’s got that familiar grid look, which is a good thing. It’s like your trusty toolbox – straightforward and ready to get the job done.
Now, imagine you’ve got a bunch of big jobs to track, like in utilities – stuff like Main Installation, Tie Ins, all the way to Meter Relights and Retirements. In Smartsheet, each of these jobs gets its own grid. It’s like having a dedicated section in your toolbox for each major task.
Take Main Installation, for example. You’d track things like how much boring you’ve done (bore footage), when you did it (install date), who was on the job (install crew), and safety checks (locates called in). Each of these gets its own column in the grid. So, where a row meets a column, that’s your specific detail – like “how much bore we did on job 123”.
The cool part? You can pump data into these grids in different ways, like using forms or dumping a bunch of info all at once. This is where the magic happens – automation. I know, automation used to be a dirty word, thinking it’s cutting jobs. But here’s the twist: it’s about making your workday less about paperwork and more about the real deal – quality and safety.
In utilities, we don’t just have someone to manage tasks; we’ve got project managers running the show. So, when you put all these tasks together in Smartsheet, you’ve got a big picture view, something like a Work Breakdown Structure or a Gantt chart. It’s like laying out your whole project on the garage floor, seeing every piece and how it fits together.

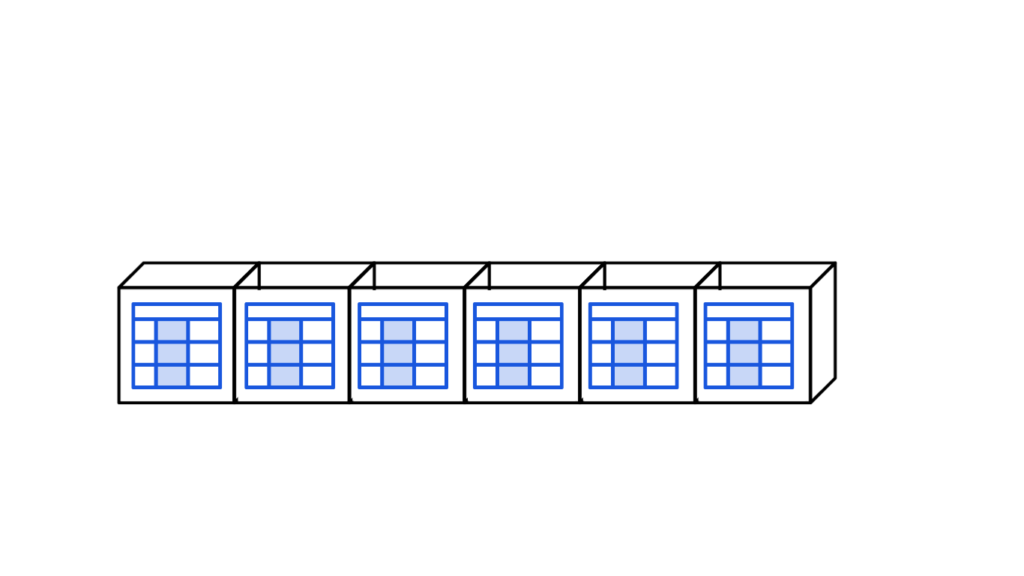
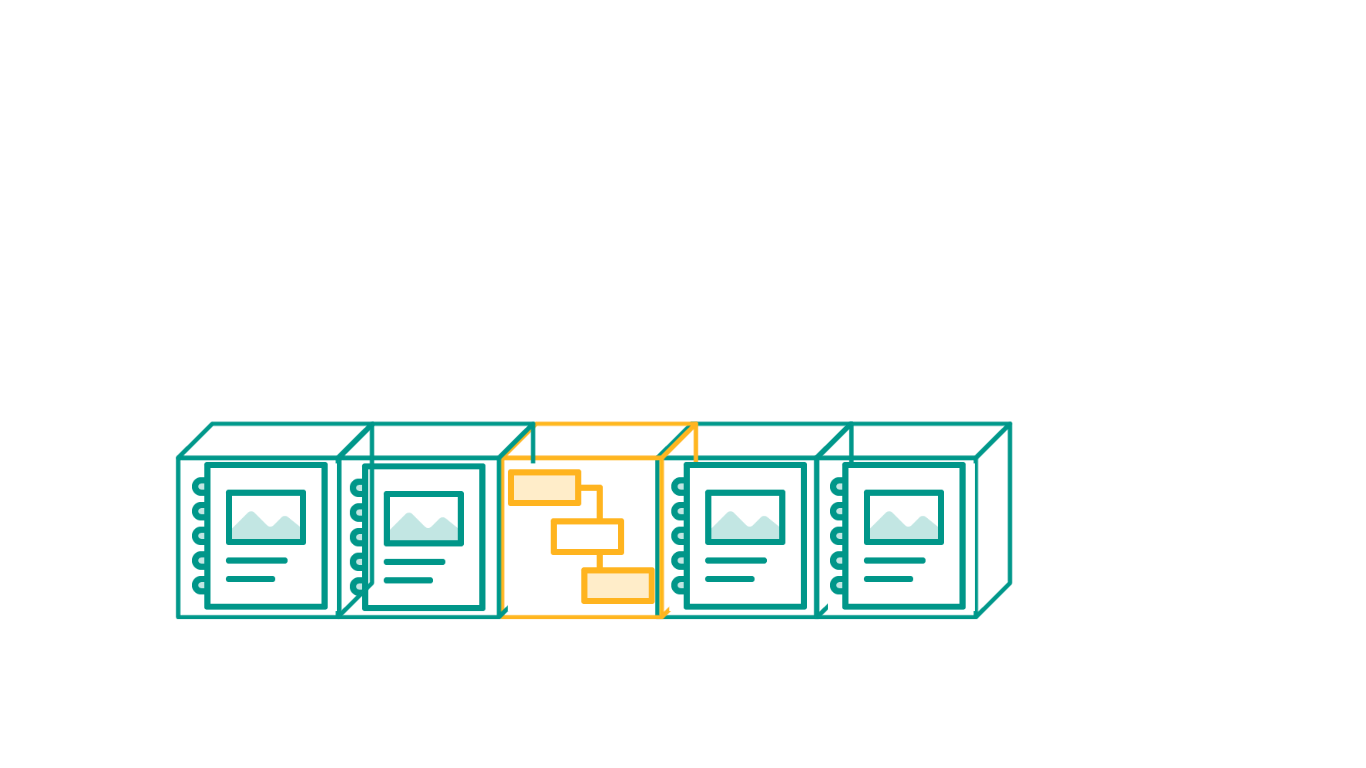
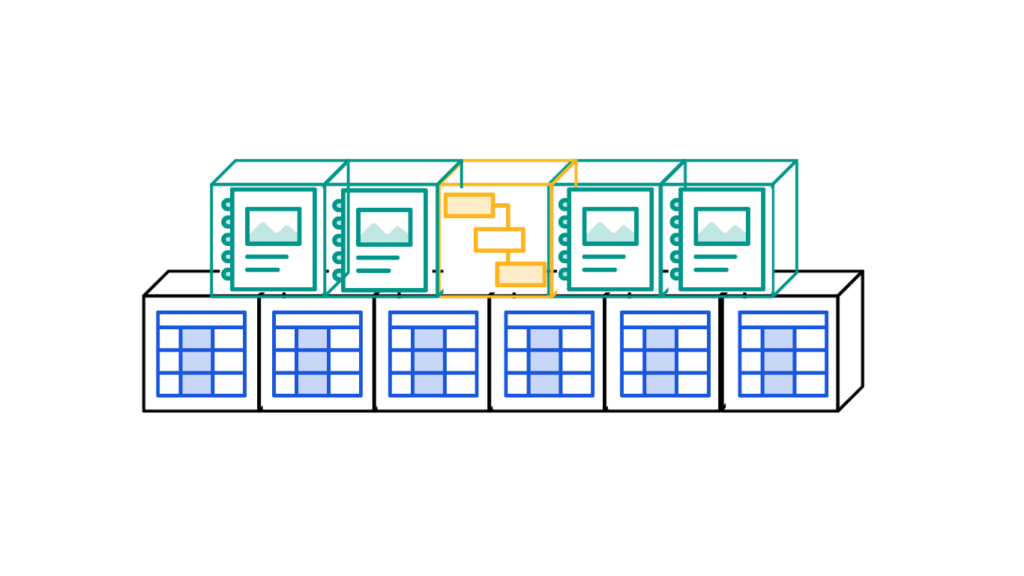
Your Project With 6 Sheets
This is your project with 6 sheets. No fancy stuff going on yet. Maybe you have added some formulas or some automation, but this breaks it down simply. Adding our Gantt Chart to the top, it resembles the basic organizational structure of your project!
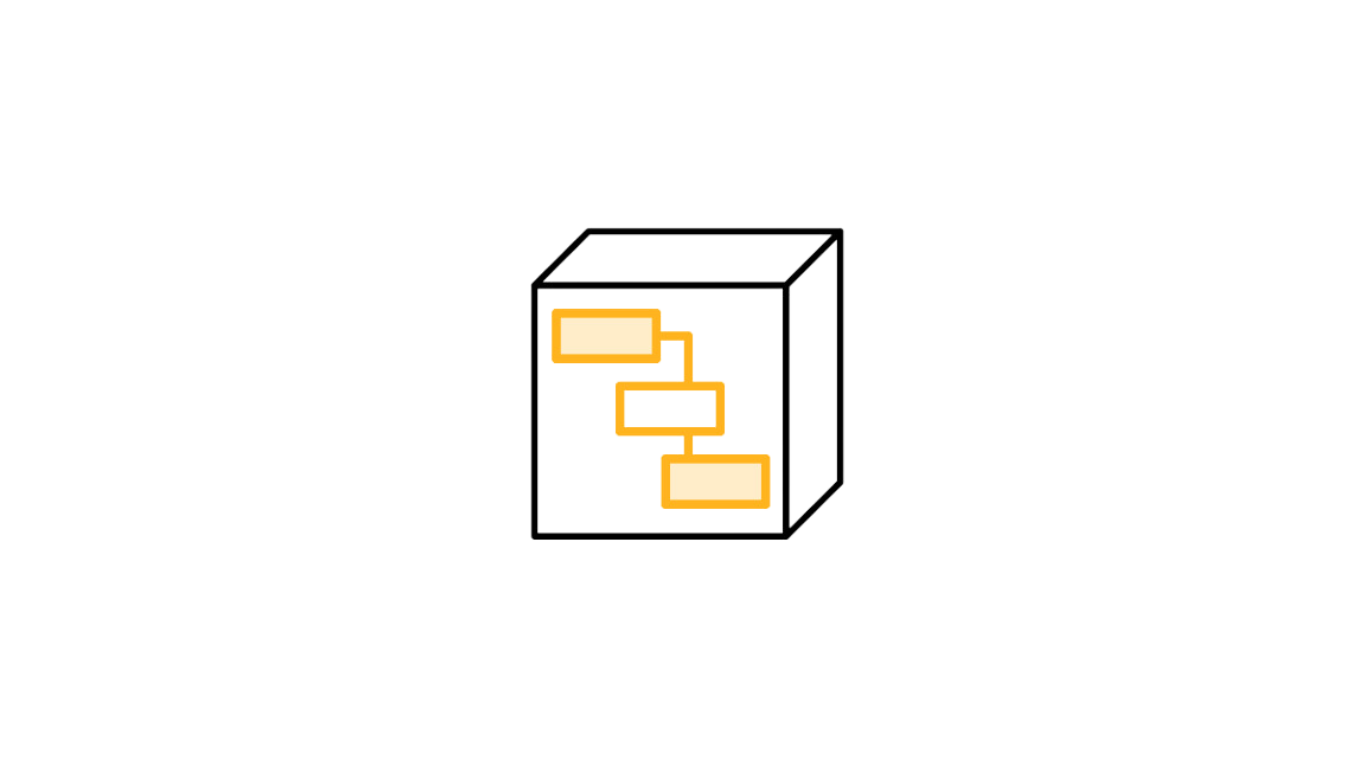
The Smartsheet "Project"
The Smartsheet "Project"
A Work Breakdown Structure is exactly as it sounds. It is not as complicated as it may seem. I imagine my work in terms of hierarchy, let me show you.
- Program – Integrity Management
- Portfolio A – Cast Iron Retirement
- Project Apple St
- Task Main Installation
- Sub Task Call 811’s
- Sub Task White Line
- Sub Task Verify Locates
- Sub Task Spot Dig
- Sub Task Drill and Pull Back
- Sub Task Back Fill
- Sub Task Documentation
- Tie Ins
- Main Finalization (Pressure Test, Gas Up, Continuity Testing etc…)
- Service Installations
- Meter Relights
- Retirements
- Task Main Installation
- Project Orange St
- Project Banana Ave
- Project Apple St
- Portfolio B – Problematic Plastic Pipe Retirement
- Portfolio C – Bare Steel Retirement
- Portfolio A – Cast Iron Retirement
You can see the 5 tiers of Project Hierarchy above. Beginning with the Program and arriving at the Sub Task. A Work Break Down Structure for a Project only focuses on the Tasks and Sub Tasks. This is where you start. It is likely the tasks of your project are also the deliverable line items found in the scope of work. Here is where the magic happens.
Using cell formulas (not column formulas here) enter a cross sheet reference to each of the tasks that accurately grabs the data stored in the grid sheets and analyzes the data for KPI’s. The example I will use is totaling bore footage. Now imagine, whenever a foreman turns in a bore log, the footage he entered is automatically added in your work break down structure. We can carry this over to every task in our work breakdown structure so that our entire Gantt chart is responsive to the incoming field data stored in our grids.
Are you following me here?
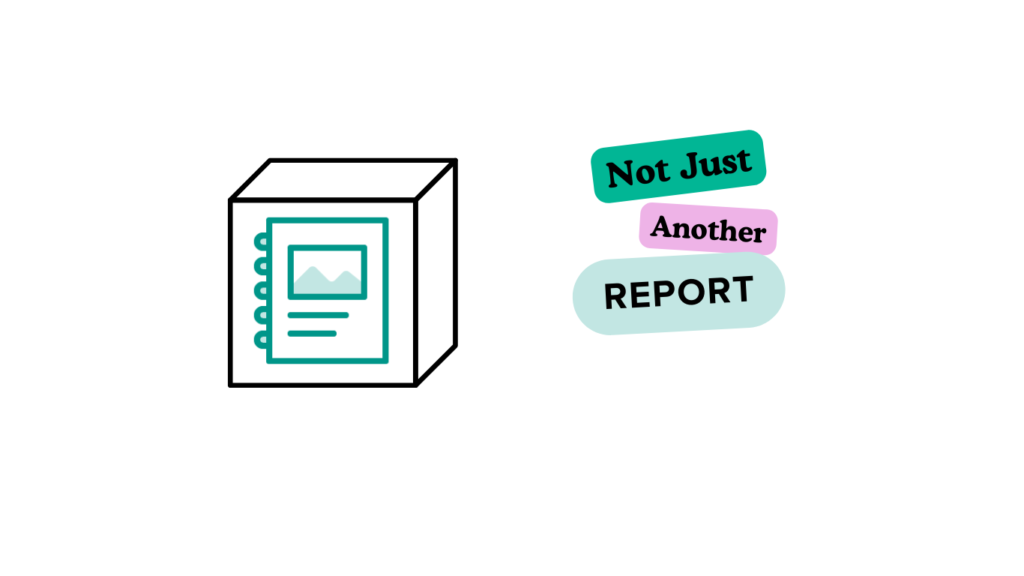
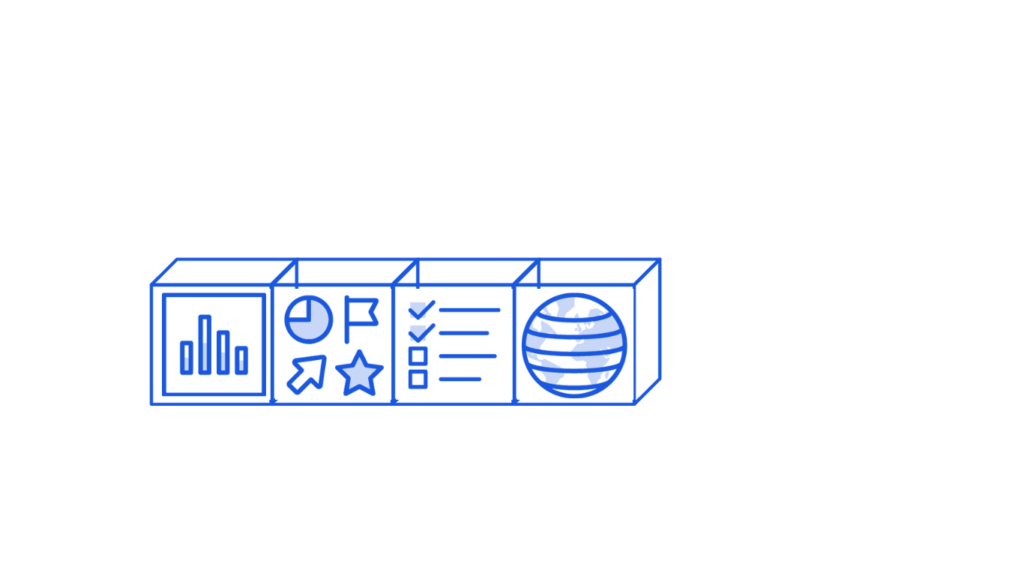
The Smartsheet "Report"
The Smartsheet "Report"
Alright, let’s talk about reports in a way that makes sense for the folks in the field and the office. Reports in Smartsheet aren’t just fancy paperwork; they’re like your go-to tool for two key jobs: picking out the important bits (isolating) and putting all the pieces together (aggregating).
Isolating: Think of a dashboard like the display in your truck. You want to see the crucial stuff like your speed, fuel level, and maybe the temperature. Now, imagine if that dashboard showed everything – like every little bit of engine data. It’d be too much. In Smartsheet, reports let you pick just the info you need, like only the speed and fuel level. This is perfect when you’re showing the big bosses or stakeholders what’s going on without overwhelming them with every little detail.
Aggregating: This is like taking all the different jobs your crew is doing – drilling bores, installing services, setting up meters – and putting it all in one place to see the total cost. It’s like having a summary of all the different jobs your crews are working on, all in one report.
Think of reports as being on the same level as your project plan or WBS. They’re there to pull together all the info and make it tell the story of your project. You use them to get a clear picture of what’s happening, just like you’d use a map to figure out where all your crews are and what they’re doing.
Now, let’s shift gears to dashboards. Think of a dashboard like the control panel in your truck. It gives you a quick, clear view of everything that’s important – like how the project’s going, where your teams are at, and what needs your attention right away. It’s all about getting the big picture at a glance, so you can make smart decisions fast.
The Project "Data"
This is your project with 6 sheets. No fancy stuff going on yet. Maybe you have added some formulas or some automation, but this breaks it down simply. Adding our Gantt Chart to the top, it resembles the basic organizational structure of your project!
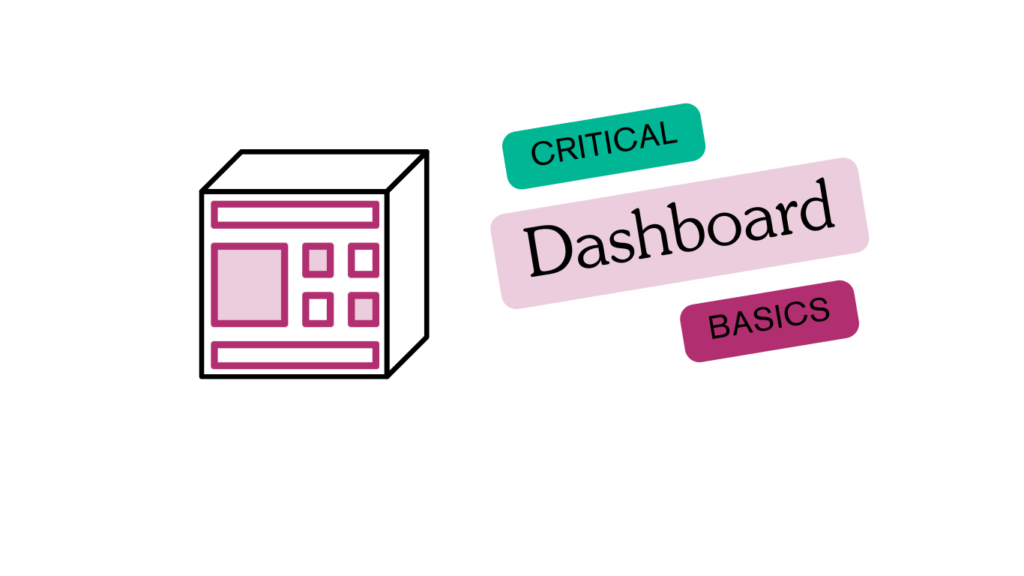
The Smartsheet "Dashboard"
The Smartsheet "Dashboard"
The Smartsheet dashboard is the Icing on the cake. All of the work that has been done up to this point has been done to collect data, analyze data and now it is time to visualize the data. Smartsheet does a world class job of simplifying the creation of these dashboards through the usage of widgets.
These are the following widget options currently offered by Smartsheet.
- Metric. A Metric is a widget that holds single entries of data such as numerical KPI’s, Project Meta Data (Work Order Number, PO Amount, etc…) or even critical contacts. Metrics are pulled from sheets or sheet summary data. Sheet summary data is the best place to store a task’s KPI’s such as bore footage installed today, total cost installed today or maybe total installed by crew 1.
- Chart. A Chart is a visual way of representing project data. Charts can be pulled from sheets or reports. To use sheet summary data in a chart, it is first necessary to create a sheet summary report and then use that report for the chart. It is always recommended to explore the different chart types to find a solution that best works for you. Don’t forget to interact with the charts, they are not static!
- Shortcut. Shortcuts are something I initially overlooked until my projects became slightly more involved. I include them in every dashboard I create. For scenarios where you need to put a quick link to a OneDrive folder or a client’s website, shortcuts are the right way to do that.
- Report. Reports are a neat way of further segmenting report data and adding it to the dashboard. For those who prefer to visualize data in a simple grid, a report is a great option. I have had managers in the past who refused to enjoy the simplicity of a chart and instead request to see the tables. This is for those folks.
- Title. Titles are like headings to a webpage. Simple stuff.
- Rich Text. Rich text is like the paragraph to this webpage. Also simple stuff.
- Web Content. This widget is critical. We use this widget for google docs, slideshows but most importantly, GIS MAPS. Click here you are interested in learning more about “How to Add A Map to Smartsheet“
- Image. This is often an overlooked widget. Beyond simply displaying an image, the image widget can be used as a button for links. With enough images, you can use these as icons and make a dashboard as an entire home screen to a project.


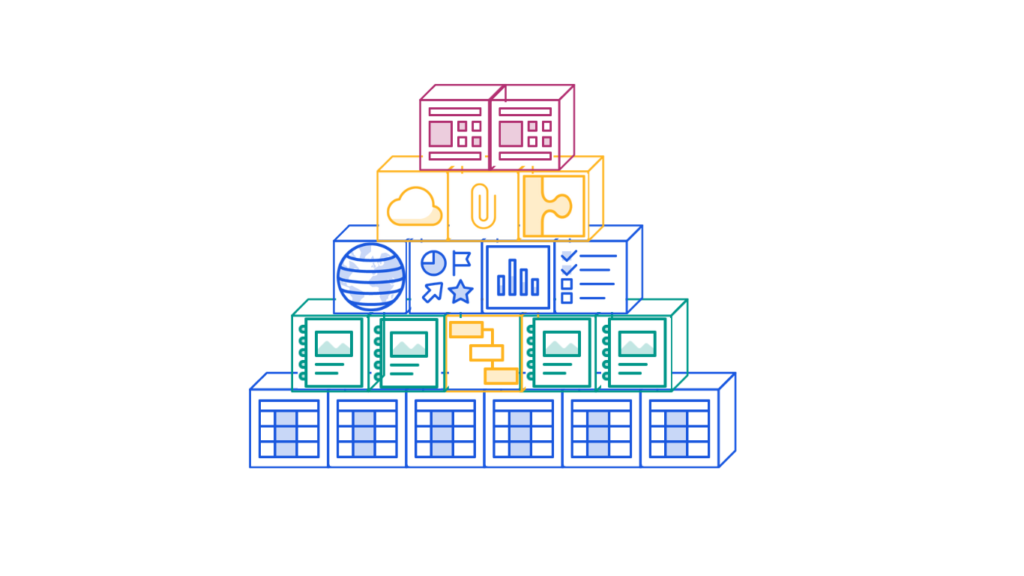
Visualizing the "Data"
With all 6 sheets rolled up into two dashboards; we have created many different possibilities. You might be wondering…
- What about roles?
- I thought this was different than excel… do I really need to enter my data in a grid?
The answers to those questions are below. It will exceed your expectations.
The Smartsheet "Work App"
The Smartsheet "Work App"
The Smartsheet Work App is where the role’s component of Smartsheet begins. Everything we have discussed is a basic building block of Smartsheet but is not Smartsheet in its entirety. So many folks stop here, at the business plan, and believe this is all Smartsheet has to offer.
This is not true.
It is time to scale. As your organization grows, so do the challenges. Roles become more important as ever when we figure that a single project in a larger organization will have a project coordinator, project manager, office coordinator, chief inspector, foreman, superintendent and several managers overseeing the program.
This is when many companies call Skyway Consulting Co. If this is you, you should too. Please review our home page for more information including contact information.
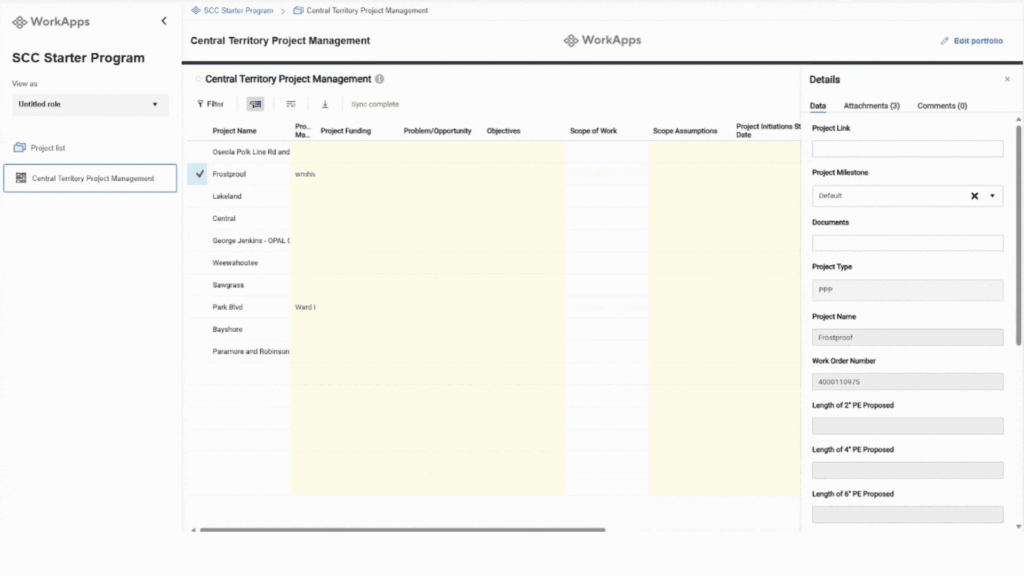
Work App’s is a way to take every component that is built in Smartsheet and package it into an interact role-based platform. Imagine the following scenarios.
- A Project Manager needs the Work Break Down Structure and Project Dashboard but is largely un-interested in the Bore Logs or Service Cards as this would fall on the Chief Inspector.
- A Chief Inspector needs only the reports but is uninterested in the financials.
- The Manager only needs the data, as their Work App is a one stop shop for a Portfolio View.
Smartsheet Work App’s will accommodate this by role-based platform. First, the organization will different roles and assign the different needed Smartsheet content accordingly. The “Browse” screen within Smartsheet largely becomes obsolete except for licensed users who are also developers. The Work App becomes the place users work; this is unavailable to standard business users.
This is why so many fall short of seeing all of Smartsheet before they give up. Don’t let this be you.
The Smartsheet Work App is where the role’s component of Smartsheet begins. Everything we have discussed is a basic building block of Smartsheet but is not Smartsheet in its entirety. So many folks stop here, at the business plan, and believe this is all Smartsheet has to offer.
This is not true.
It is time to scale. As your organization grows, so do the challenges. Roles become more important as ever when we figure that a single project in a larger organization will have a project coordinator, project manager, office coordinator, chief inspector, foreman, superintendent and several managers overseeing the program.
This is when many companies call Skyway Consulting Co. If this is you, you should too. Please review our home page for more information including contact information.
Work App’s is a way to take every component that is built in Smartsheet and package it into an interact role-based platform. Imagine the following scenarios.
- A Project Manager needs the Work Break Down Structure and Project Dashboard but is largely un-interested in the Bore Logs or Service Cards as this would fall on the Chief Inspector.
- A Chief Inspector needs only the reports but is uninterested in the financials.
- The Manager only needs the data, as their Work App is a one stop shop for a Portfolio View.
Smartsheet Work App’s will accommodate this by role-based platform. First, the organization will different roles and assign the different needed Smartsheet content accordingly. The “Browse” screen within Smartsheet largely becomes obsolete except for licensed users who are also developers. The Work App becomes the place users work; this is unavailable to standard business users.
This is why so many fall short of seeing all of Smartsheet before they give up. Don’t let this be you.
Assigning the Work
Assigning the work can be a challenge but with practice, you will get the hang of it. This brings up the next point… we haven’t created anything with a user-friendly interface yet. You’re probably not sold yet. It is time to deploy Smartsheet Advanced, the final tier of Smartsheet Licenses.
The Smartsheet "Dynamic View"
The Smartsheet "Dynamic View"
Breaking down Smartsheet’s Dynamic View, we can think of it like a high-tech tool in your toolkit, but one that’s really easy to use. It’s all about making your life easier by organizing data in a way that makes sense. Let’s look at the key parts:
1. User Roles: It’s like assigning different jobs to your crew. In Dynamic View, you set up roles for users, controlling who sees what. It’s like making sure the electrician doesn’t get mixed up with the plumbing plans.
2. Ergonomics: This is all about making things comfortable and efficient. Forget about the old days of scrolling through endless rows in an Excel spreadsheet. Dynamic View lets you find what you need fast, using priority fields. You click on what interests you, and if you want to see more, just scroll with your mouse. It’s like having a tool that adjusts to fit your hand perfectly.
3. Compartmentalization and Logic: Imagine you’ve got a big toolbox. You wouldn’t throw all your tools in there in a jumble. You’d organize them, right? That’s what compartmentalization in Dynamic View does. It sorts your data into neat categories, like planning and execution. Think of it like having different drawers in your toolbox for different types of tools. By using dropdown menus, you can switch between categories easily. It’s about keeping everything tidy and easy to find.
And here’s the best part: You can plug these views into a dashboard or a work app, so everything you need is right at your fingertips. It’s like having a customized control panel for your project. You won’t even need to go back to the old grid view.
Want to dive deeper into this? Hit up Skyway for a chat, and we’ll get you up to speed on making the most of Dynamic View. It’s all about using the right tools to make your job easier. Connect Now
Scaling the Work
A common worry is that this is ALOT of work for a single project. Will this need to be created for every project? No. Let’s find out why. It is time to learn how Smartsheet is an industry leader in Project and Portfolio Management Solutions. We will begin by putting our project “in a box” called a blueprint.
The Smartsheet "Control Center"
The Smartsheet "Control Center"
Smartsheet Control Center is like a powerhouse tool for handling big projects and keeping everything under control. It’s all about making things easier and more organized. Let’s break it down into three main parts:
1. Creating Projects: Think of this like setting up a construction site. The first thing you do is create a blueprint. In Smartsheet, these blueprints are like your project templates. They’ve got everything you need – grids, reports, dashboards – all set up and ready to go. Imagine you’ve packed all these tools into a box. When you start a new project, you use this blueprint to clone all these tools. You collect the project info on an “intake sheet,” and once it’s approved, your new project is set up automatically, just like the blueprint. It’s like having a prefab kit for every new job.
2. Monitoring and Updating Portfolios: Now, think about all the different jobs you’re managing at once. Each of these is a project, and together they make up your portfolio. In Smartsheet, all these projects created from your blueprint are linked together. It’s like having a bird’s-eye view of every job site. And if you need to make a change across all projects, you can do it in one shot with global updates. It’s like updating your plans and having every job site get the memo at the same time.
3. Archiving Projects: Once a job’s done, you don’t just leave all your tools out. You pack them up and store them away. That’s what archiving is in Smartsheet. When a project is finished, you check a box, and it gets stored neatly away in a folder. It’s out of your current project list but still there if you need to look back at it.
So, Smartsheet Control Center isn’t just about managing a project. It’s about managing a whole bunch of projects, making sure they’re set up right, running smoothly, and neatly wrapped up when they’re done. It’s like being the foreman of a huge construction site with all the right tools at your fingertips.
To all my readers, today we’ve taken a deep dive into the world of Smartsheet, going beyond the misconception that it’s just another spreadsheet tool.
We’ve explored its unique capabilities that make it indispensable in dynamic project management, especially in fields like construction and engineering. We’ve broken down the complexities of Work Breakdown Structures, reports, Dynamic Views, and the Control Center, showing how each feature brings efficiency and clarity to your projects. Smartsheet isn’t just about handling data; it’s about empowering you with a tool that’s as robust and multifaceted as your work demands. Whether you’re in the field or managing from the office, Smartsheet is the tool belt that equips you to handle the dynamic and challenging landscape of project management with ease and precision.
Thanks for joining me on this journey through Smartsheet’s practical, real-world applications – it’s a game-changer for those who need more than just a spreadsheet.